This article shows you how to interpret figures on the Data and Analytics page.
1 Understanding the figures
- Open the Data and Analytics page for a Chatbot.
- Scroll to the top of the page and locate the 5 data boxes.
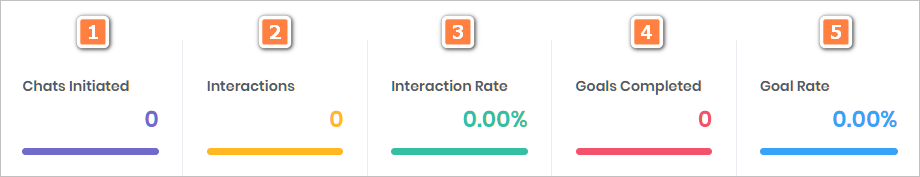
1 Chats Initiated
This counts the number of times a Chabot is opened on a website. Chatbots open when a visitor clicks or hovers the mouse pointer on the Text Overlay.
2 Interactions
This counts the number of times a website visitor enters a user response (e.g. click a button or type an email address).
3 Interaction Rate
This a calculation: interactions (#2) divided by Chatbot initiations (#1).
4 Goals Completed
This counts the number of times a goal has been achieved. A goal is a measurable user interaction on a user response item that you decided to track.
To generate data for this performance indicator, you must first select goals. For more information about creating goals, see:
5 Goal Rate
This a calculation: the number of goals completed (#4) divided by the number of interactions (#2).
2 Understanding the charts
There are 2 main charts at the bottom of the Data and Analytics page.
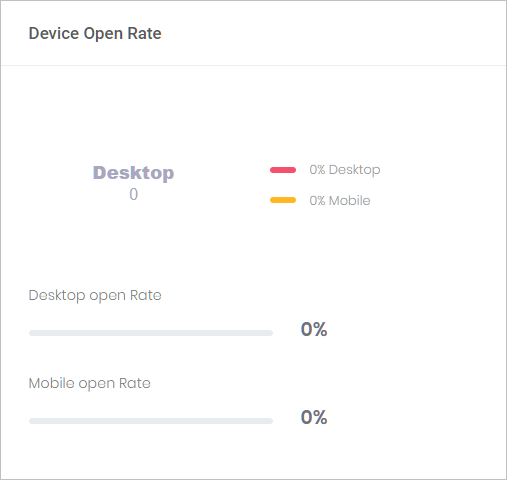
Device Open Rate
This chart takes the total number of Initiated Chats and provides a split between desktop and mobile devices.
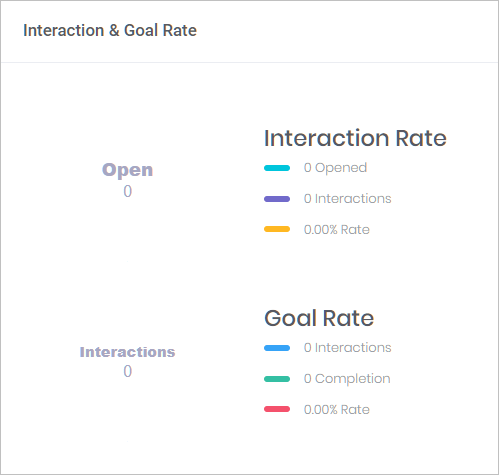
Interaction and Goal Rate
These charts summarize figures from the 5 data boxes at the top of the page.